



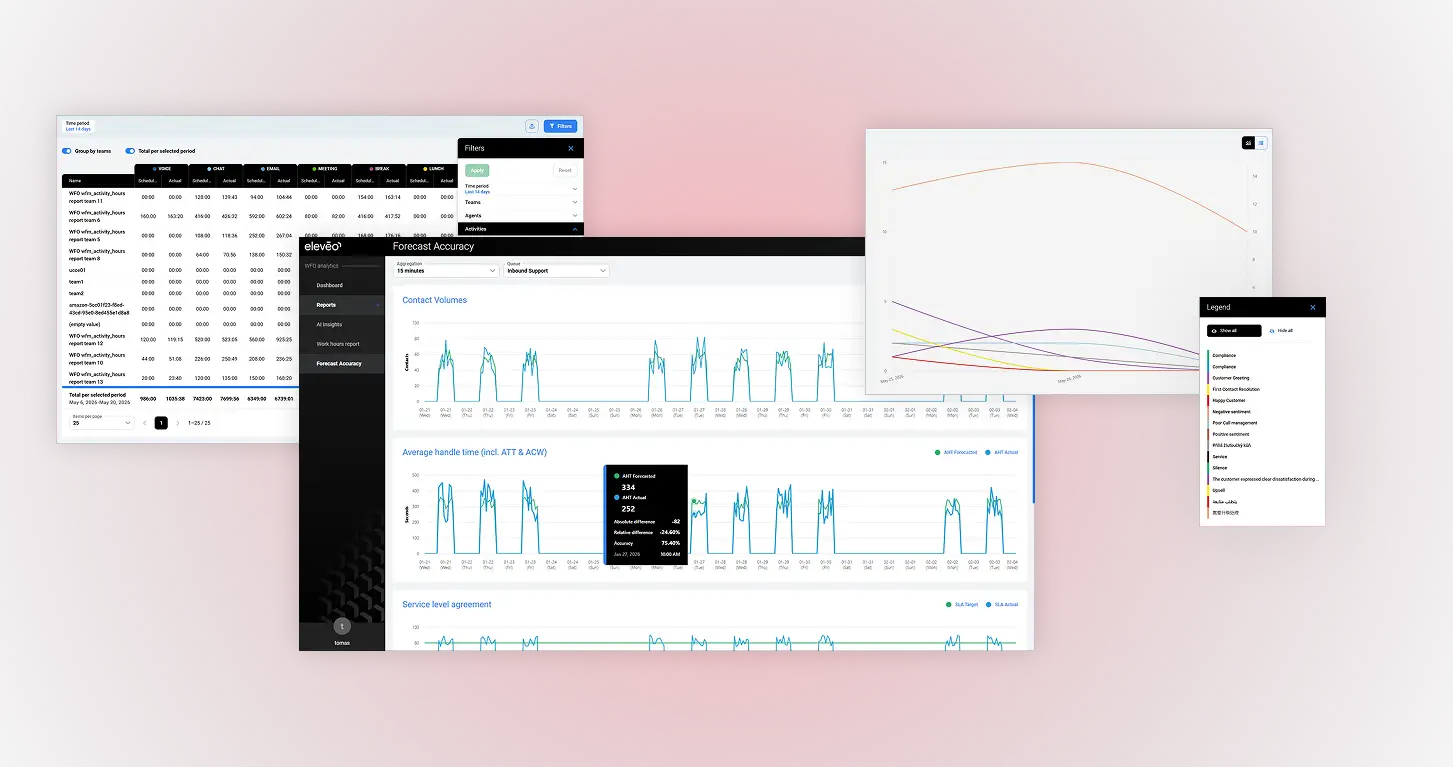
Eleveo needed to expand its WFO Analytics platform with new reports based on data from its Workforce Management system. The reports were designed to help users quickly evaluate various aspects of contact center operations, from forecast accuracy and working hours to team activities and the occurrence of monitored topics in conversations.
The solution was part of an existing microfrontend architecture built with React. The frontend displayed reports through advanced tables, interactive charts, filters, and CSV exports. The backend handled calculations, API endpoints, data cubes, and data preparation for analytical visualizations. Our delivery therefore included not only the user interface but also data transformations, test datasets, and automated tests verifying report accuracy across the entire data flow.
Development took place within a complex ecosystem involving multiple repositories, data layers, and teams. Our task was to integrate smoothly into the existing development process and efficiently adapt to the client’s established project management approach.
Our team was involved in both analytical and implementation tasks. We built the backend endpoint structure according to the client’s requirements, worked with data layers, and prepared the datasets needed to introduce robust automated testing. This required quickly understanding the existing system and coordinating across teams.
On the frontend, we built on detailed product designs and the existing microfrontend architecture. It was particularly important to follow established technical and design conventions and connect the reporting screens with data to ensure a consistent user experience across tables, charts, filters, and exports.
Testing analytical reports presented a separate challenge. For reports, simply verifying that a page renders correctly is not enough. Tests had to validate specific values in tables, charts, tooltips, and exports and compare them with expected results calculated directly from randomly generated test datasets. The goal was to detect not only UI errors but also inconsistencies between the data returned by APIs and how it was displayed on the frontend.
Thanks in part to our collaboration on previous projects, we quickly integrated into the existing development process and built on our familiarity with the client’s architecture, processes, and product standards.
Based on the client’s product requirements, we implemented reports with filters, tables, charts, and exports to support users in their everyday analytical work.
Alongside the user interface, we extended APIs, calculations, and data layers to ensure the reports displayed correct aggregations, KPIs, and detailed values.
We prepared test datasets for the reports covering various scenarios, user roles, aggregations, boundary values, and missing data.
We expanded Eleveo’s product with new analytical reports that provide users with a clear overview of key workforce metrics and help them make more accurate decisions when planning capacity, evaluating forecasts, and managing contact centers.
The project combined a user-friendly analytics interface with complex data logic behind the scenes. Each report had to work with accurate calculations, correct aggregations, and consistent values across tables, charts, and exports. Therefore, the reliability of the outputs was an integral part of the solution, from design through automated testing.

What we do